Quarterly revenue up 53%, on $1,337 of ad spend.
Stillwater Escape Co runs an escape room in Stillwater, Minnesota. We rebuilt the website first, and bookings jumped 82% before a single ad ran. Then small, careful ad budgets compounded it. They still do.
Why it mattersThe website rebuild lifted bookings 82% before a single ad dollar was spent. The ads then compounded it, averaging $8.35 back per $1 across seven months.
Great rooms. A website that was losing them.
Stillwater Escape Co had the product. What they didn't have was a site that did it justice, or a single paid dollar working for them, while about a dozen Minneapolis escape rooms with bigger budgets won the auctions nearby.
What they had going for them
- Real rooms people loved, in a real tourist town
- A crowd that skews 18 to 35, plus families
- A booking system already in place, so every booking was countable
- Seasonal demand peaks, school breaks and summer, sitting right there
What was quietly costing them
- An owner-built website that read as low effort, more pop-up shop than local attraction
- No effective paid presence behind it
- About a dozen Minneapolis escape rooms with bigger budgets winning the auctions
- No behavioral data, so every opinion about the site was just an opinion
The site had to come first.
The 30-Day Plug-In audit started with a Microsoft Clarity install, which proved the website problem with real behavioral data instead of opinions. Then we rebuilt the site so it read like the real attraction it is.
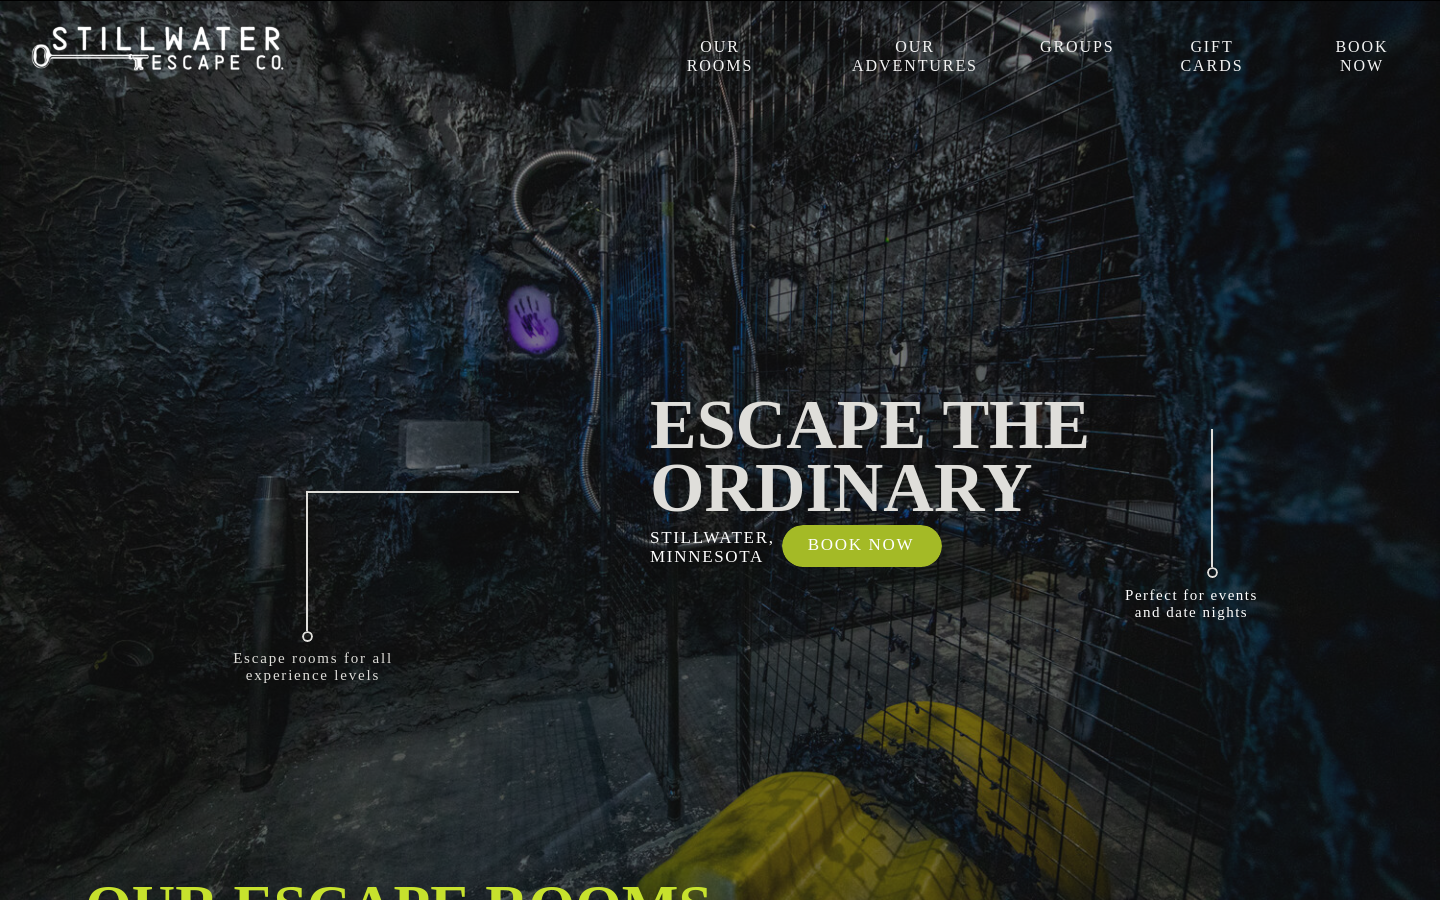
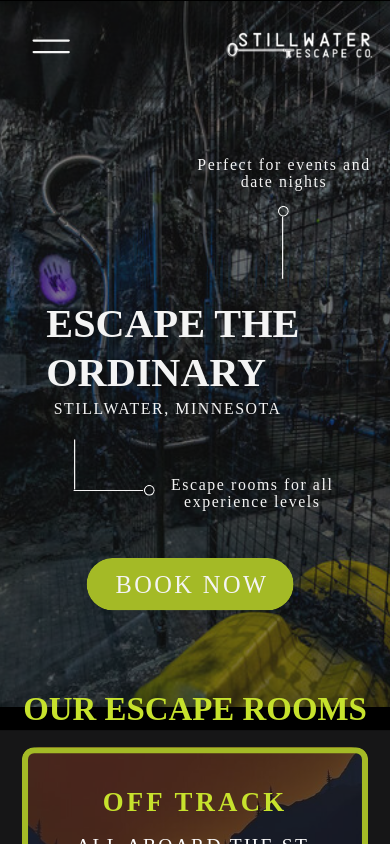
The site we built, live today at stillwaterescape.com (captured July 2026). Same rooms, same booking system: bookings went from 91 to 166 the next month, an 82% lift, with zero ad spend.
Microsoft Clarity went in on day one. Real session data, not opinions, made the case for the rebuild, and the same data has graded every change since.
Then and now.
Every engagement starts with the same audit we'd run on your business. Here's how Stillwater's marketing graded when we plugged in, and how it grades today.
Same rooms, same booking system, 82% more bookings within a month of the rebuild going live. The site now carries dedicated pages for groups, birthdays, and team events, so every ad has a real page to land on.
Google Search plus Performance Max went live January 3, 2025, aimed at the towns around Minneapolis instead of into it. Across the first seven months the ads averaged $8.35 back per $1. Meta followed in July 2025, once Google was paying for itself.
Clarity went in on day one, and e-commerce tracking was wired up in February 2025. Today ad-driven revenue is tracked month by month and cross-checked against the booking system, and the monthly report shows the down months in the same font size as the up ones.
Budget now moves into school-break and summer peaks on a calendar, not on a hunch. The best of the first seven months ran at about $12.97 back per $1.
Meta ads went live in July 2025 with small budgets and swipeable weekday offers. In April 2026, Meta's own reporting tracked 22 booking purchases on $239 of spend.
Tap any line for the detail →
Grades are how we score a marketing check-up. The facts behind each row come from Stillwater's booking systems, Google Ads, Meta, and Microsoft Clarity reporting.
Same three rituals as always.
Nothing exotic. The same three rituals we run on every engagement, pointed at an escape room. It is the kind of work we run for local businesses.
The 30-Day Plug-In
- Clarity install, access, and the baseline audit
- Proved the website problem with behavioral data
- Scoped the rebuild around booking friction
The Operator Cadence
- A working session every week, a Friday update every week
- Budget shifted into school-break demand peaks
- Anything that didn't pay got killed in the open
The 90-Day Rebuild
- New website live, bookings up 82% before ads
- Google Search plus Performance Max live January 3, 2025
- Meta added July 2025, once Google paid for itself
Minneapolis targeting. A dozen escape rooms with bigger budgets win those auctions, so we stopped paying to lose them and aimed at the towns around the city instead.
What the money did.
Three months of ads against the three months before them, then the longer arc. Every number comes from Stillwater's booking system and the ad platforms.
Revenue attributed to the ads in platform and analytics reporting, cross-checked against the booking system. The dashed column is October 2025, a tracking gap while booking-system permissions were rebuilt. We show the hole rather than smooth it.
From the April 2026 end-of-month report. Tracing each booking back to an ad is honest but imperfect; these are the same numbers we run the account by.
The searches the ads run on today:
The order was the whole trick.
Fix the thing losing customers first. Then buy demand where the big budgets aren't looking.
More bookings the month the new site went live, before a single ad dollar. Same rooms, same booking system.
Back per $1 of ad spend, averaged across the first seven months. The best month ran at about $12.97.
Sixteen months in, it's still compounding: $129,179 tracked back to the work on $31,661 all-in, fees included.
How far April 2026 came in under March. Real numbers move. We report the down months in the same size type as the record ones.
“The website had to come first. Same rooms, same booking system, 82% more bookings the next month, before we spent a dollar on ads.”
Real engagement. Numbers from Stillwater's booking systems (Resova, then its successor), Google Ads, Meta, and Microsoft Clarity reporting. How we present results
More of the work: Benchmark Insurance Group and Go Swag
Want results like this?
Curious what your own numbers could do? Book a free analysis, or see more of the work.